

Drought Mitigation Center, United States National
United States Agricultural Commodities in Drought Archive
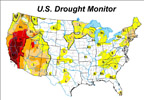
Weekly reports show a drought map of the United States, plus maps of US crop areas experiencing drought (map), approximate percentage of crop located in drought, by state (bar graph), and percent of crop area located in drought, past 52 weeks (line graph), for some or all of the following: corn, soybeans, hay, cattle, and winter wheat.
2021
U.S. Drought Monitor, November 30, 2021
U.S. Drought Monitor, November 9, 2021
U.S. Drought Monitor, October 12, 2021
U.S. Drought Monitor, October 19, 2021
U.S. Drought Monitor, October 26, 2021
U.S. Drought Monitor, October 5, 2021
U.S. Drought Monitor, September 14, 2021
U.S. Drought Monitor, September 21, 2021
U.S. Drought Monitor, September 28, 2021
U.S. Drought Monitor, September 7, 2021
2020
U.S. Drought Monitor, April 14, 2020
U.S. Drought Monitor, April 21, 2020
U.S. Drought Monitor, April 28, 2020
U.S. Drought Monitor, April 7, 2020
U.S. Drought Monitor, August 11, 2020
U.S. Drought Monitor, August 18, 2020
U.S. Drought Monitor, August 25, 2020
U.S. Drought Monitor, August 4, 2020
U.S. Drought Monitor, December 1, 2020
U.S. Drought Monitor, December 15, 2020
U.S. Drought Monitor, December 22, 2020
U.S. Drought Monitor, December 29, 2020
U.S. Drought Monitor, December 8, 2020
U.S. Drought Monitor, February 11, 2020
U.S. Drought Monitor, February 18, 2020
U.S. Drought Monitor, February 25, 2020
U.S. Drought Monitor, February 4, 2020
U.S. Drought Monitor, January 14, 2020
U.S. Drought Monitor, January 21, 2020
U.S. Drought Monitor, January 28, 2020
U.S. Drought Monitor, January 7, 2020
U.S. Drought Monitor, July 14, 2020
U.S. Drought Monitor, July 21, 2020
U.S. Drought Monitor, July 28, 2020
U.S. Drought Monitor, July 7, 2020
U.S. Drought Monitor, June 16, 2020
U.S. Drought Monitor, June 2, 2020
U.S. Drought Monitor, June 23, 2020
U.S. Drought Monitor, June 30, 3030
U.S. Drought Monitor, June 9, 2020
U.S. Drought Monitor, March 10, 2020
U.S. Drought Monitor, March 17, 2020
U.S. Drought Monitor, March 24, 2020
U.S. Drought Monitor, March 31, 2020
U.S. Drought Monitor, March 3, 2020
U.S. Drought Monitor, May 12, 2020
U.S. Drought Monitor, May 19, 2020
U.S. Drought Monitor, May 26, 2020
U.S. Drought Monitor, May 5, 2020
U.S. Drought Monitor, November 10, 2020
U.S. Drought Monitor, November 17, 2020
U.S. Drought Monitor, November 24, 2020
U.S. Drought Monitor, November 3, 2020
U.S. Drought Monitor, October 13, 2020
U.S. Drought Monitor, October 20, 2020
U.S. Drought Monitor, October 27, 2020
U.S. Drought Monitor, October 6, 2020
U.S. Drought Monitor, September 1, 2020
U.S. Drought Monitor, September 15, 2020
U.S. Drought Monitor, September 22, 2020
U.S. Drought Monitor, September 29, 2020
U.S. Drought Monitor, September 8, 2020
2019
U.S. Drought Monitor, April 16, 2019
U.S. Drought Monitor, April 2, 2019
U.S. Drought Monitor, April 23, 2019
U.S. Drought Monitor, April 30, 2019
U.S. Drought Monitor, April 9, 2019
U.S. Drought Monitor, August 13, 2019
U.S. Drought Monitor, August 20, 2019
U.S. Drought Monitor, August 27, 2019
U.S. Drought Monitor, August 6, 2019
U.S. Drought Monitor, December 10, 2019
U.S. Drought Monitor, December 17, 2019
U.S. Drought Monitor, December 24, 2019
U.S. Drought Monitor, December 31, 2019
U.S. Drought Monitor, December 3, 2019
U.S. Drought Monitor, February 12, 2019
U.S. Drought Monitor, February 19, 2019
U.S. Drought Monitor, February 26, 2019
U.S. Drought Monitor, February 5, 2019
U.S. Drought Monitor, January 1, 2019
U.S. Drought Monitor, January 15, 2019
U.S. Drought Monitor, January 22, 2019
U.S. Drought Monitor, January 29, 2019
U.S. Drought Monitor, January 8, 2019
U.S. Drought Monitor, July 16, 2019
U.S. Drought Monitor, July 2, 2019
U.S. Drought Monitor, July 23, 2019
U.S. Drought Monitor, July 30, 2019
U.S. Drought Monitor, July 9, 2019
U.S. Drought Monitor, June 11, 2019
U.S. Drought Monitor, June 18, 2019
U.S. Drought Monitor, June 25, 2019
U.S. Drought Monitor, June 4, 2019
U.S. Drought Monitor, March 12, 2019
U.S. Drought Monitor, March 19, 2019
U.S. Drought Monitor, March 26, 2019
U.S. Drought Monitor, March 5, 2019
U.S. Drought Monitor, May 14, 2019
U.S. Drought Monitor, May 21, 2019