Drought Mitigation Center, United States National

United States Agricultural Commodities in Drought Archive
Date of this Version
8-12-2014
Document Type
Article
Citation
http://droughtmonitor.unl.edu
Abstract
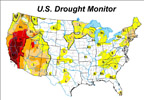
Drought map of U.S. for August 12, 2014 (8/12/14) plus: U.S. crop areas experiencing drought (map), Approximate percentage of crop located in drought, by state (bar graph), Percent of crop area located in drought, past 52 weeks (line graph) for: Corn, Soybeans, Hay, Cattle, Winter wheat.
Included in
Agricultural Economics Commons, Environmental Indicators and Impact Assessment Commons, Environmental Monitoring Commons, Hydrology Commons, Natural Resource Economics Commons, Other Environmental Sciences Commons, Water Resource Management Commons


Comments
Produced by USDA, National Drought Mitigation Center, U.S. Department of Commerce, and National Oceanic and Atmospheric Administration.